Ground vibration on construction site
Applications
Location: Nanterre, France
Site monitored since: November 2017
OVERLL TASKS
At the beginning, Grand Paris (Greater Paris) is a project to transform the Paris metropolitan area into a major world and European metropolis of the 21st century, in order to improve the living environment of the inhabitants, to correct the territorial inequalities and to build a sustainable city.
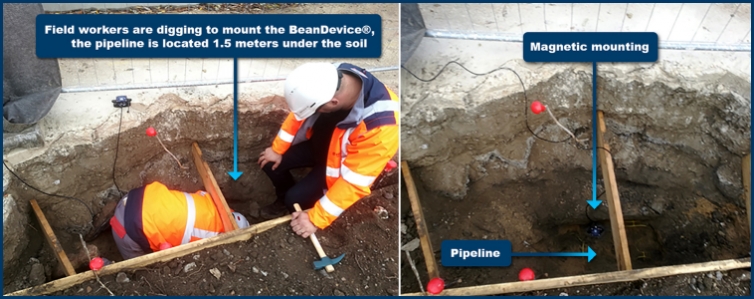
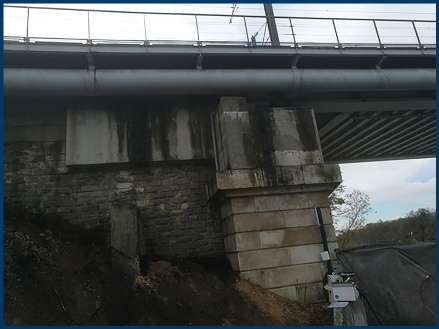
During the suburb train line (RER) in Nanterrre, the monitoring work consisted to track ground vibration on gas and water pipeline during construction work alongside the bridge structure.
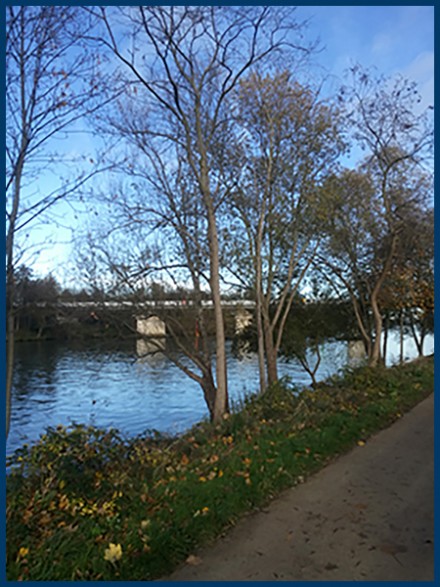
Caption 1:
Overall view of monitoring site
EQUIPMENT USED
The following materials were deployed on the monitoring site:
• 12 x wireless vibrations sensors (Ref: BeanDevice® Wilow AX-3D) were deployed
• 1 x IOT Gateway with 3G/4G/LTE connectivity provides a remote access
• 1 x BeanScape® RA (Remote access)
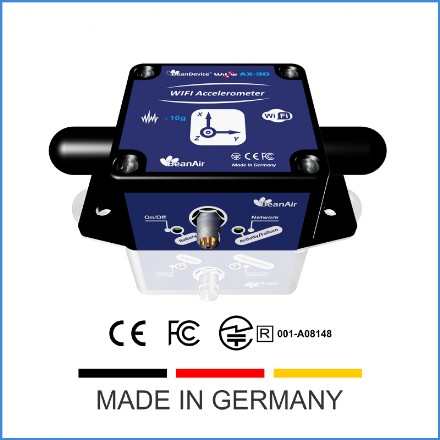
BeanDevice® Wilow® AX-3D , Wireless Vibration sensor (acceleration and Velocity)
Due to the low noise, the BeanDevice® Wilow® AX-3D is suitable for Static Velocity Measurement on construction material
OPERATION MODE
• DAQ Mode: Streaming with event-trigger (S.E.T.) with 100Hz of sampling rate
• Alarm thresholds : 1.4G on Z axis and 0.4G on X and Y Axis
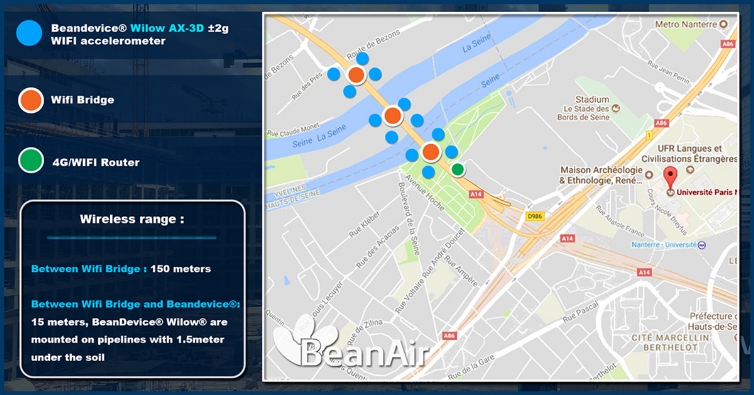
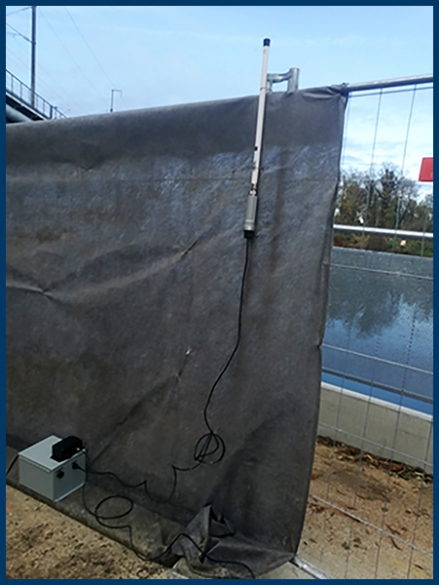
Caption 2: IOT sensors deployment alongside the bridge structure
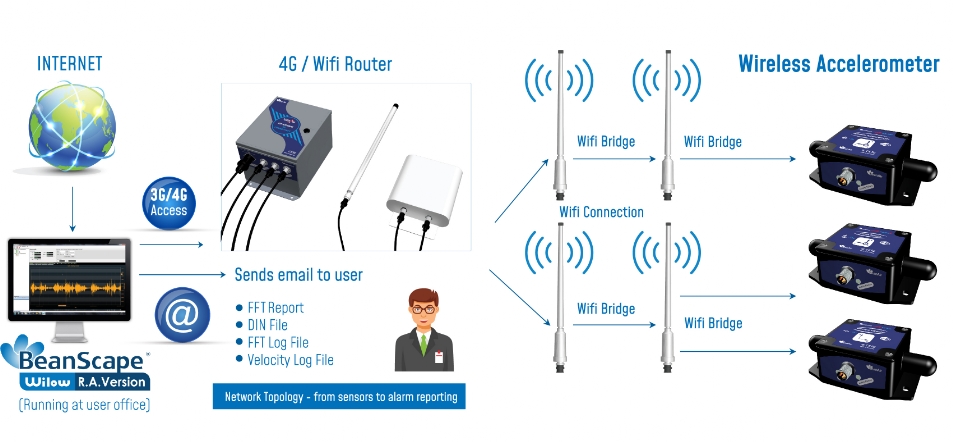
Caption 3 : Network Topology - from sensors to alarm reporting
Caption 4: IOT Vibration sensor installation on pipeline (BeanDevice® Wilow® AX-3D)
Caption 5: WIFI Bridge is used to extend the wireless range
Caption 6: IOT Gateway with 3G/4G/LTE Connectivity
DAQ MODE CONFIGURATION
Streaming with Event-Trigger (S.E.T.) data acquisition mode Notification Cycle :
Every 10 minutes, the BeanDevice® Wilow® transmits a notification to the BeanScape® Wilow® software
Sampling rate and Data Acquisition duration :
When a trigger is reached, the BeanDevice® Wilow® transmits data measurement to the supervision software for a duration of 10 seconds with a sampling rate of 100 Hz
Datalogger :
Only measurements with a value higher than the threshold are recorded on the onboard datalogger (5 millions Logs)
ONLINE DATA ANALYSIS MODE :
Online Data Analysis Module enables Real-Time FFT and PPV ( Peak Particle Velocity):
• Automatic FFT and PPV reports ( following DIN4150-3 standard)
• Real-Time FFT and PPV display
Streaming with Event Trigger S-E-T data acquisition mode
Signal Processing Module
ALARMS TRIGGER
Caption 9 : Alarms trigger on X Axis
Caption 10: Alarms trigger on Y Axis
Caption 11 : Alarms trigger on Z Axis
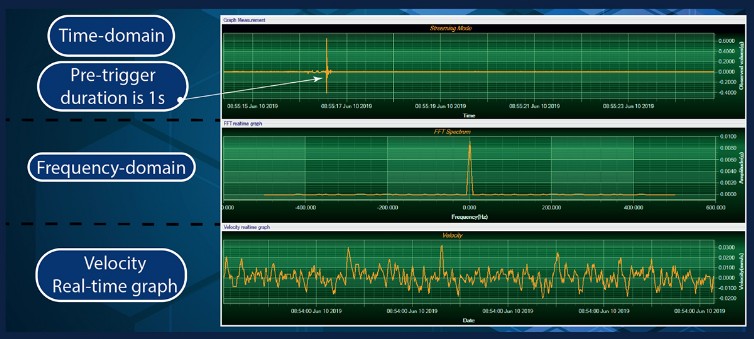
Caption 12: Real-Time Velocity and FFT (Fast Fourrier Transform)

